MatLab Teaching
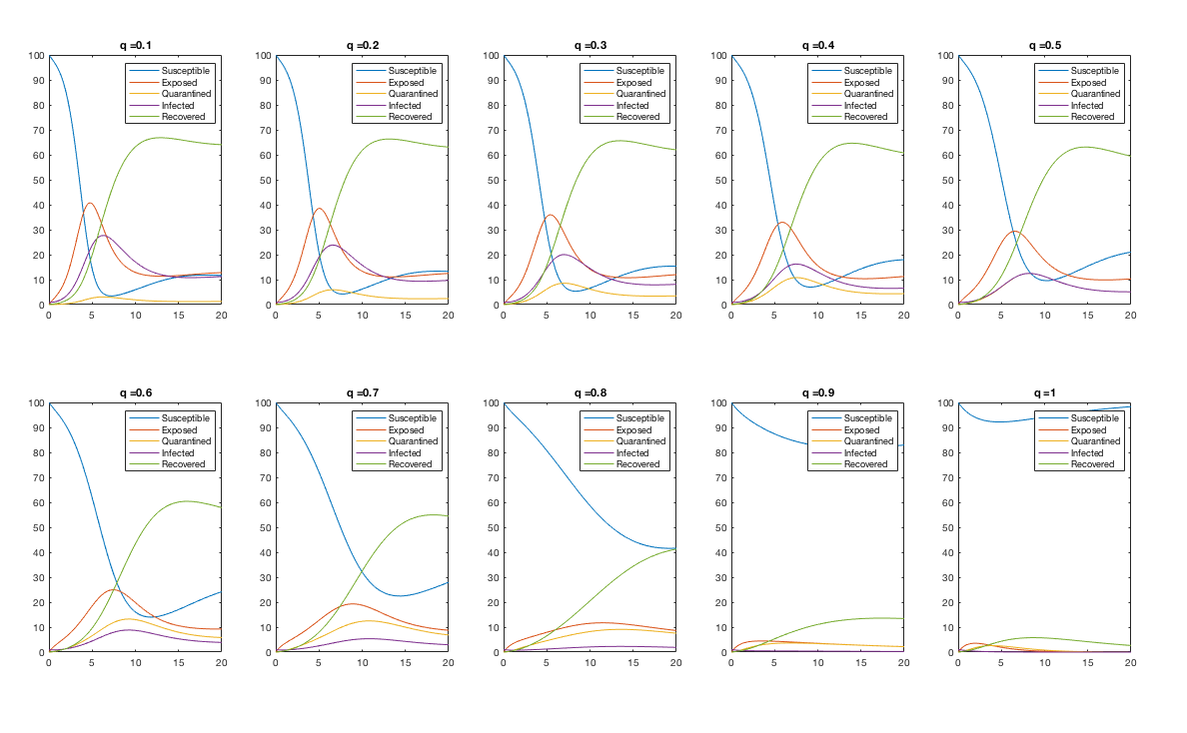
In Spring 2020, I taught weekly computer labs for an Applied Math course in mathematical modeling. In one lab, I taught students how to model the spread of disease through the SEIR model. For homework, they modified the model to include various levels of quarantine and gave recommendations based on their results. Below is sample output with various parameters q = .1, ..., .9, 1.0 representing the proportion of exposed individuals who are quarantined until they recover. A high level of quarantine compliance (q = .9 or larger) leads to a contained outbreak.
SEIR Lab PDF
Sample solution (.m file)
SEIR Lab PDF
Sample solution (.m file)
Bayesian Statistics in R
At The College of New Jersey, I took a course in Bayesian Statistics that included coding in R. I've attached my final project below. In the first problem, I used the Metropolis-Hastings method to determine the distributions and parameters of a univariate sample of mixed distributions. In the second problem, I needed to use a Markov Chain Monte Carlo method to determine the mean and standard deviation in each dimension of a five-dimensional data set. To simplify the problem, I bootstrapped samples to show that only two pairs of variables had statistically significant correlation; the other variables could be treated as independent. I then used a Gibbs sampler to sample from the proposed distributions and determine credible intervals for the mean and standard deviation in each dimension.
Bayesian Statistics Final Project PDF
R file
Data file (.rda)
Bayesian Statistics Final Project PDF
R file
Data file (.rda)
SnapPy
I am currently working on collecting data on the length spectrum of hyperbolic 3-manifolds using the Python-based SnapPy program, which was written by Marc Culler, Nathan Dunfield, and Matthias Goerner and built on the SnapPea kernel of Jeff Weeks. I am working on some preliminary analysis in R and MatLab and look forward to sharing results.
